To journal your trades effectively, record six things for every position: the setup, your entry and exit, position size, the outcome, and what you learned. Do it within 60 seconds of closing the trade. Review your data every Sunday for 20 minutes. That single habit separates traders who improve from traders who repeat the same mistakes for years.
If you are not sure what a trading journal is or why it matters, start there. This guide assumes you are ready to build the habit and walks you through the full process, from choosing a format to making data-driven strategy changes.
Step 1: Choose Your Format
You have three options: a notebook, a spreadsheet, or dedicated software. Pick the one that matches your trade volume.
Notebook: Best for swing traders placing 1 to 3 trades per week. Zero friction to start. The limitation is that you cannot run analytics on handwritten notes, so pattern recognition stays manual.
Spreadsheet: Best for active traders taking up to 5 trades per day. Our free Google Sheets template tracks 15 fields per trade and auto-calculates P&L, R multiples, win rate, and profit factor. The limitation is manual data entry, which takes 2 to 3 minutes per trade.
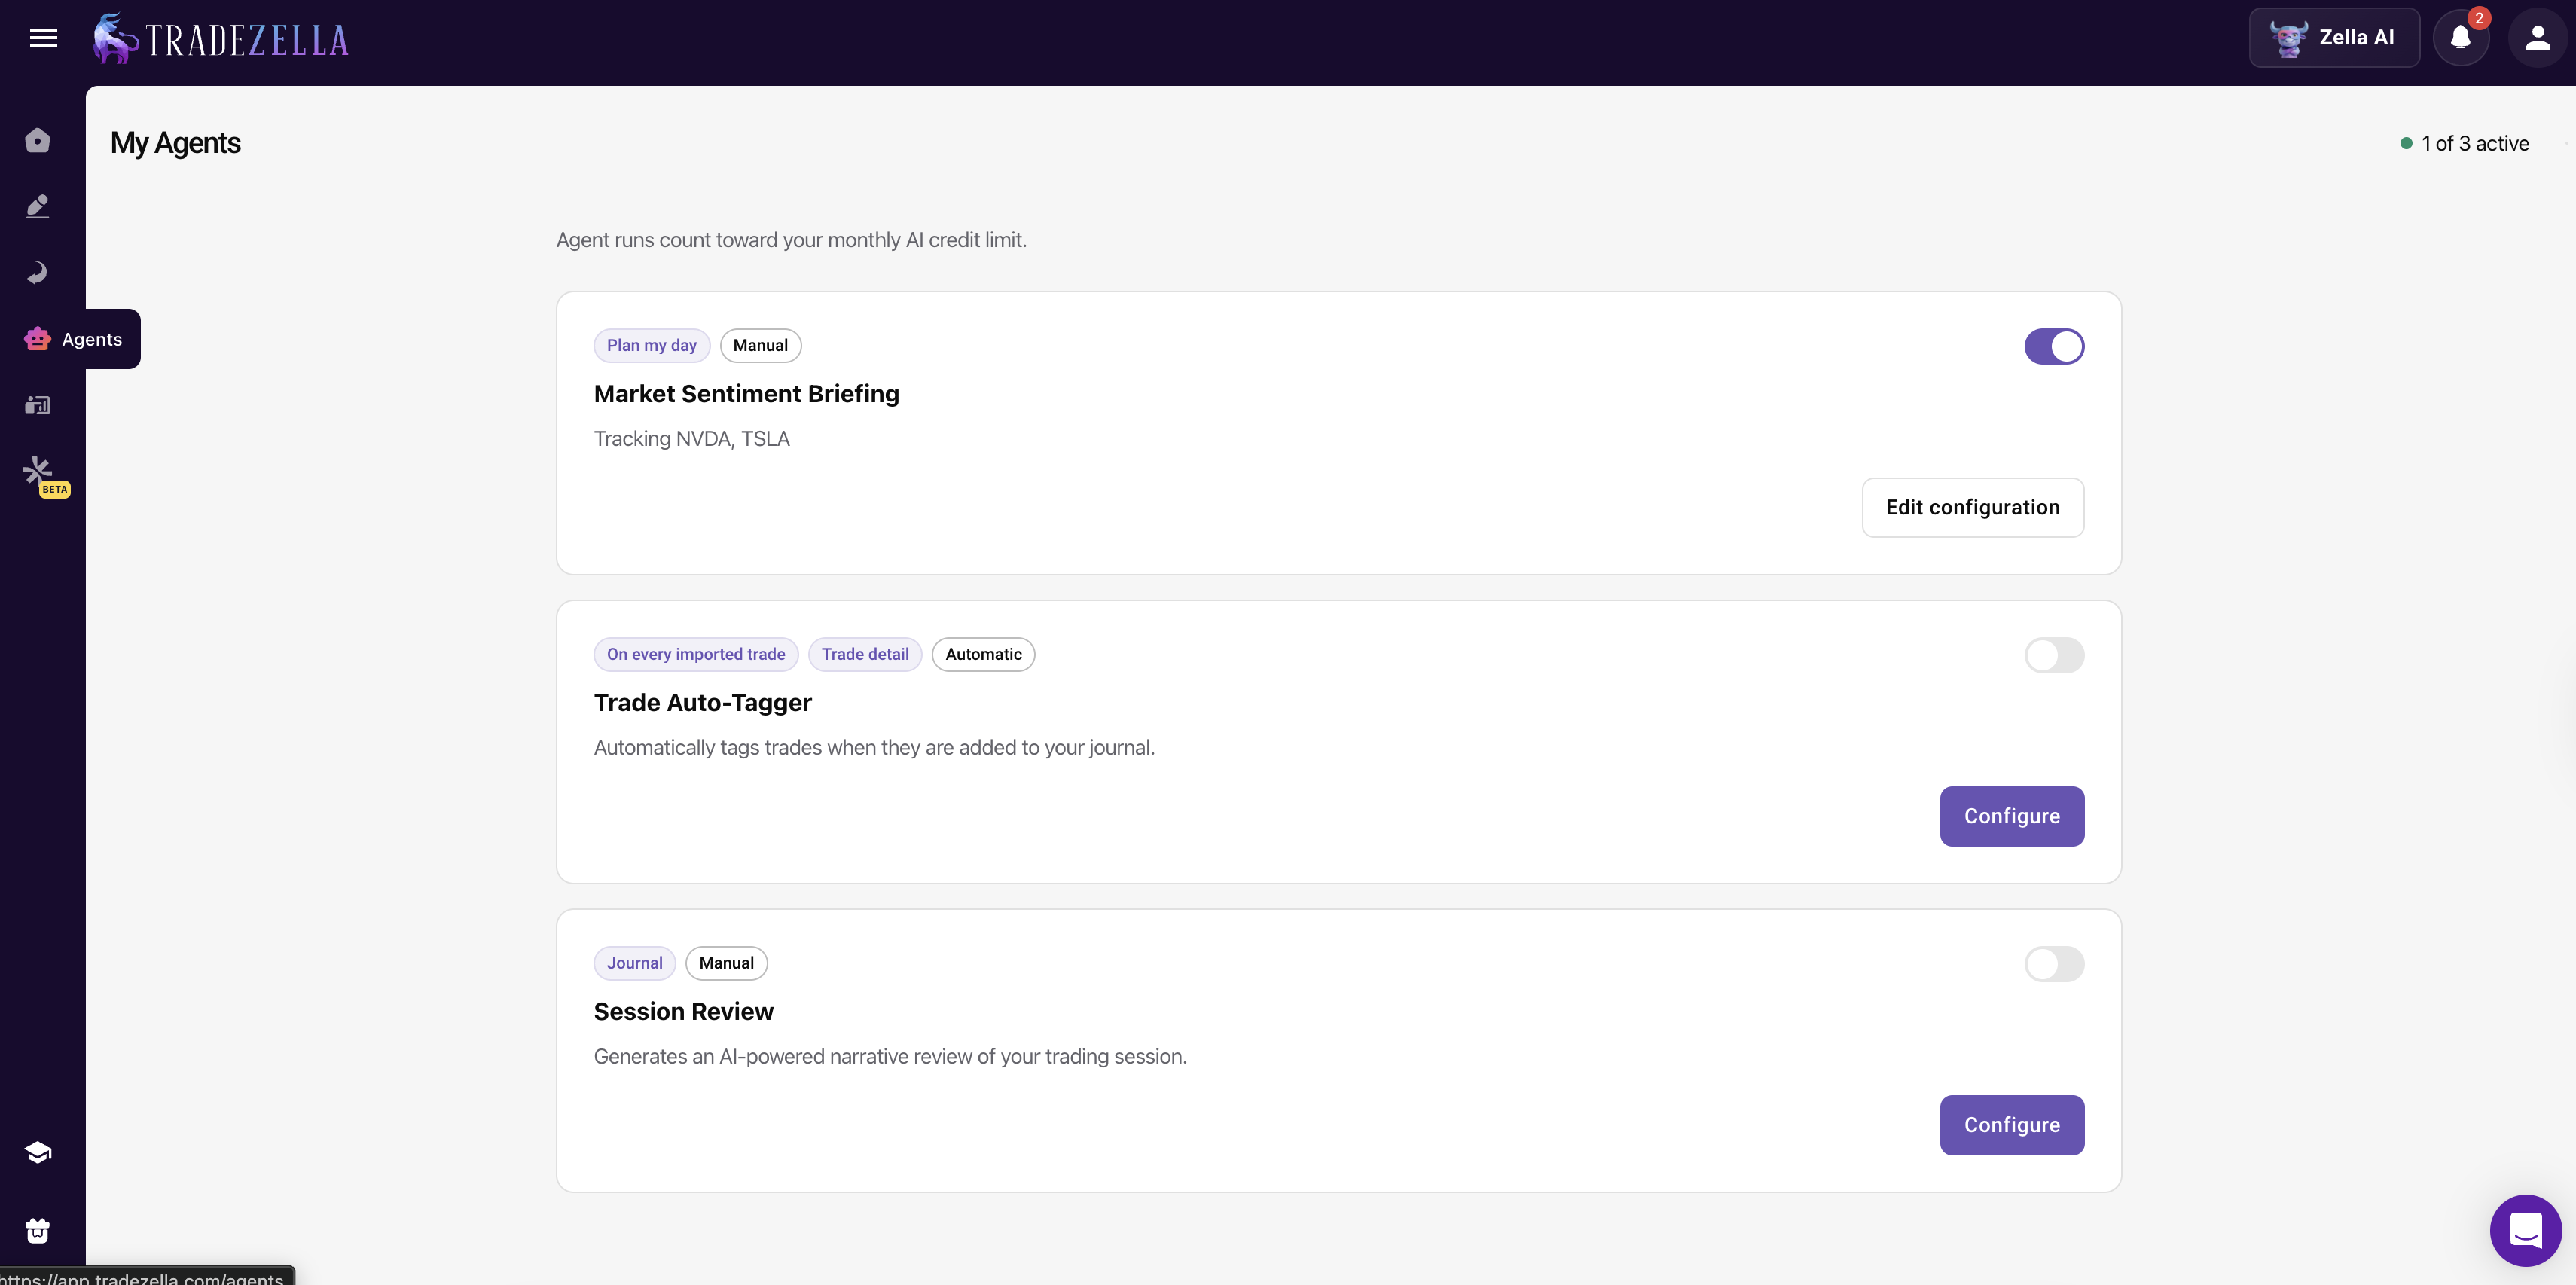
Software: Best for day traders taking 5+ trades per day. TradeZella ($29/mo) auto-imports from 500+ brokers, generates 50+ analytics reports, and includes Zella AI, a built-in AI that lets you ask any question about your trading data and runs automated agents for trade tagging, pre-session briefings, and post-session reviews. The best AI trading journal on the market. TraderSync ($29.95/mo) covers 950+ brokers with Cypher AI coaching. Edgewonk ($197/year) offers 200+ importers and Tiltmeter psychology tracking. See our full best trading journals ranking for comparisons.
Start with the free spreadsheet. If you find yourself skipping entries because of the manual effort, upgrade to software. The best journal is the one you actually use consistently.
Step 2: Record Every Trade
Log these fields for every single trade, winners and losers alike:
| Field | Example | Why It Matters |
|---|---|---|
| Date & Time | 3/4/26, 9:42 AM | Reveals your best and worst trading hours |
| Ticker | NVDA | Shows which instruments you trade best |
| Direction | Long | Exposes directional bias in your results |
| Entry Price | $142.50 | Calculates P&L and measures execution quality |
| Exit Price | $146.20 | Determines actual outcome |
| Position Size | 200 shares | Tracks whether you size correctly for your risk |
| Stop Loss | $141.00 | Required for R multiple calculation |
| P&L | +$740 | The bottom line |
| R Multiple | 2.47R | Normalizes trade quality regardless of size |
Log within 60 seconds of closing the trade. Not at the end of the day. Not on the weekend. The emotional context of a 9:35 AM trade is gone by 7 PM. Immediate logging captures what delayed logging cannot.
Step 3: Tag Your Setups
Every trade gets a setup label. This is the single most valuable field in your journal because it lets you calculate performance by strategy type.
Common setup tags:
- Breakout: price clears a defined resistance level on volume
- Pullback: entry on a retracement within an established trend
- VWAP Bounce: price tests VWAP and reverses
- Gap Fill: trading the fill of an overnight gap
- ICT OTE: entry in the optimal trade entry zone after displacement
- Mean Reversion: fading an extended move back to the mean
Define each setup in one sentence so your labels stay consistent. "Breakout" should mean the same thing on trade 1 and trade 200. Without clear definitions, your setup-level analytics become noise.
After 100 tagged trades, you can see exactly which setups make money and which drain your account. Most traders discover that one or two setups carry all the profit while the rest break even or lose.
Step 4: Note Your Emotional State
Before you enter the trade, rate your emotional state on a simple scale: calm, confident, anxious, frustrated, excited, revenge, FOMO. One word is enough.
This field feels subjective, and it is. That is exactly why it works. After 50 trades, you will see a clear correlation between emotional state and outcomes. Traders routinely discover that 60% to 80% of their losses happen in two or three emotional states.
Edgewonk's Tiltmeter automates this by assigning a tilt score to each trade and showing the correlation over time. But even a handwritten "frustrated" or "calm" next to each trade is powerful enough to change your behavior.
The goal is not to eliminate emotions. It is to build awareness of which emotions cost you money, so you can recognize them before you click the button.
Step 5: Screenshot Your Charts
Take two screenshots for every trade: one at entry showing your setup, and one after exit showing the full move. Annotate them with your entry, stop, and target levels.
Why this matters: numbers tell you what happened. Charts tell you why. During your weekly review, the screenshots let you relive the trade visually and spot things the numbers miss. Did price give a clear rejection signal you ignored? Was your entry five cents too early? Did the setup look clean, or were you forcing it?
If you use software, this is built in. TradeZella stores annotated charts with every trade and offers trade replay in three modes, letting you re-watch the price action tick by tick. Manual traders can use the Snipping Tool (Windows) or Command+Shift+4 (Mac) and paste screenshots into a Google Doc or folder organized by date.
Step 6: Review Weekly
This is where the journal earns its value. Block 20 to 30 minutes every Sunday. Here is exactly what to do:
- Calculate win rate by setup type. Which strategies are profitable? Which are bleeding money? If your breakout trades win at 58% and your mean-reversion trades win at 37%, that is actionable data.
- Calculate average R by setup type. Win rate alone is incomplete. A setup with a 45% win rate but a 2.5:1 average R is more profitable than a 65% win rate setup with a 0.8:1 average R.
- Check performance by time of day. Group your trades by hour. Most traders have one or two windows where they consistently lose money. The fix is simple: stop trading during those hours.
- Review emotional trades. Filter for trades where you logged frustration, revenge, or FOMO. Calculate the win rate and average R for those trades separately. The numbers are usually ugly, and that is the point.
- Identify your top 3 and bottom 3 trades. Review the screenshots. What did the best trades have in common? What patterns do you see in the worst ones?
Step 7: Adjust Your Strategy
Your journal data tells you exactly what to change. Here are real examples of journal-driven adjustments:
- "My journal shows a 35% win rate on afternoon trades. I am stopping all trading after 1 PM."
- "My breakout trades average 2.1R. My VWAP bounces average 0.4R. I am dropping VWAP bounces from my playbook."
- "I average 3.2 revenge trades per week with a 22% win rate. New rule: 15-minute break after any loss."
- "My win rate drops from 57% to 38% when I trade more than 8 positions per day. New cap: 8 trades maximum."
Make one change at a time. Trade the adjusted plan for two to four weeks, then re-evaluate. Small, data-driven changes compound into massive improvements over months.
A Complete Journal Entry: Example
Here is what a fully logged trade looks like in practice:
| Date | March 4, 2026 |
| Time | 9:42 AM ET |
| Ticker | NVDA |
| Direction | Long |
| Setup | Breakout (pre-market high on volume) |
| Entry | $142.50 |
| Stop | $141.00 (risk: $1.50/share) |
| Target | $147.00 |
| Exit | $146.20 |
| Size | 200 shares |
| P&L | +$740 (+2.6%) |
| R Multiple | 2.47R |
| Emotion | Confident, 8/10 |
| Followed Plan? | Yes |
| Notes | Clean break of pre-market high at open. Held through the first pullback to $143.80 without moving stop. Exited at $146.20 when momentum slowed near the $147 target. Would have been a full target hit if I held 10 more minutes, but the exit was disciplined. A+ execution. |
This entry takes 90 seconds to fill in. After 200 entries like this, you have a personal trading database that reveals exactly where your strengths and weaknesses are.
Frequently Asked Questions
Should I journal paper trades?
Yes. Paper trades are where you build the journaling habit without financial pressure. Log them exactly as you would log real trades. The habits you build in simulation carry directly into live trading. Many funded trader programs evaluate your journal quality alongside your P&L.
What if I forget to journal a trade?
Log it as soon as you remember, even if it is the next day. Mark it with a note that the entry was delayed so you know the emotional data may be less accurate. If you use software with auto-import, the trade data is captured automatically; you only need to add notes and tags.
Do professional traders keep journals?
Yes. Most prop trading firms require daily journals from every trader. Firms like SMB Capital and Maverick Trading treat journaling as a core part of development. The traders who pass funded evaluations overwhelmingly track their trades in detail.
Should I journal on weekends or non-trading days?
You should not fabricate entries on days you did not trade, but non-trading days are ideal for review and reflection. Use Saturdays or Sundays to write a brief weekly summary: what went well, what patterns you noticed, and what one rule you will focus on next week. This "meta-journal" entry takes 10 minutes and gives your weekly review a written record you can revisit months later to track how your thinking has evolved.
When is the best time of day to review my journal?
Review after the market closes but before the next session opens. For most U.S. stock traders, Sunday evening or early Monday morning works best because you have distance from the week's emotions but the trades are still fresh enough to recall context. Avoid reviewing during live market hours, as it splits your attention and often triggers impulsive trades based on what you just analyzed. The goal is calm, objective assessment, not real-time decision-making.
How long should a trading journal entry take?
60 to 90 seconds per trade if you have a structured template. The key fields (ticker, setup, entry, exit, P&L, emotional state, rule adherence) take less than a minute to fill in. If you use journal software with auto-import, the trade data is already there and you only need to add your notes and tags. Spending more than 2 minutes per entry usually means your template has too many fields. Keep it lean.
Should I include screenshots in my trading journal?
Yes. Chart screenshots are one of the highest-value fields in a journal entry. Mark your entry, stop loss, and target on the chart before saving. During weekly review, visual patterns jump out faster than raw numbers. Platforms like TradeZella embed charts directly in the journal entry. If you use a spreadsheet, paste screenshots into a separate folder and link them from your log.
What is the best app for journaling trades?
The top dedicated trade journaling platforms are TradeZella (best overall and best AI trading tool with Zella AI, 50+ reports, backtesting, and trade replay), TraderSync (best mobile experience with iOS and Android apps), and Edgewonk (best for trading psychology tracking). All three auto-import trades from your broker and generate performance analytics. TradeZella stands out as the most AI-forward option with Zella AI, which lets you ask questions about your data in plain language and runs automated agents for trade tagging, session briefings, and post-session reviews.
How do I categorize my trade setups in a journal?
Create a fixed list of 5 to 8 setup names you actually trade (e.g., breakout, pullback, VWAP bounce, gap fill, reversal). Tag every trade with one setup name. After 50+ trades, filter your journal by setup to see which ones are profitable and which are not. This is one of the fastest ways to improve, because most traders discover that 1 to 2 setups produce nearly all of their profits while 2 to 3 setups consistently lose money.
Can I journal trades on my phone?
Yes, but with limitations. Google Sheets works on mobile for basic logging. Among dedicated journal apps, TraderSync offers native iOS and Android apps. TradeZella and Edgewonk are web-based and work in mobile browsers but do not have native mobile apps. If quick mobile logging is a priority, TraderSync is the best option. For in-depth review and analysis, most traders prefer desktop regardless of platform.